Brief: Help design and develop a dashboard for the Department for International Trade, so that every portfolio and department can keep track of its investments for their respective portfolios.
The department uses multiple Excel sheets and generates reports to compile a progress report. Senior department officials, ministers and others had to go through various report sheets to view the progress of their portfolios. There was no at-a-glance view or a greater value to a smaller value view. A lot of time, effort and expertise went into this report generation. It also proved to be very painstaking and not sustainable in the long run.
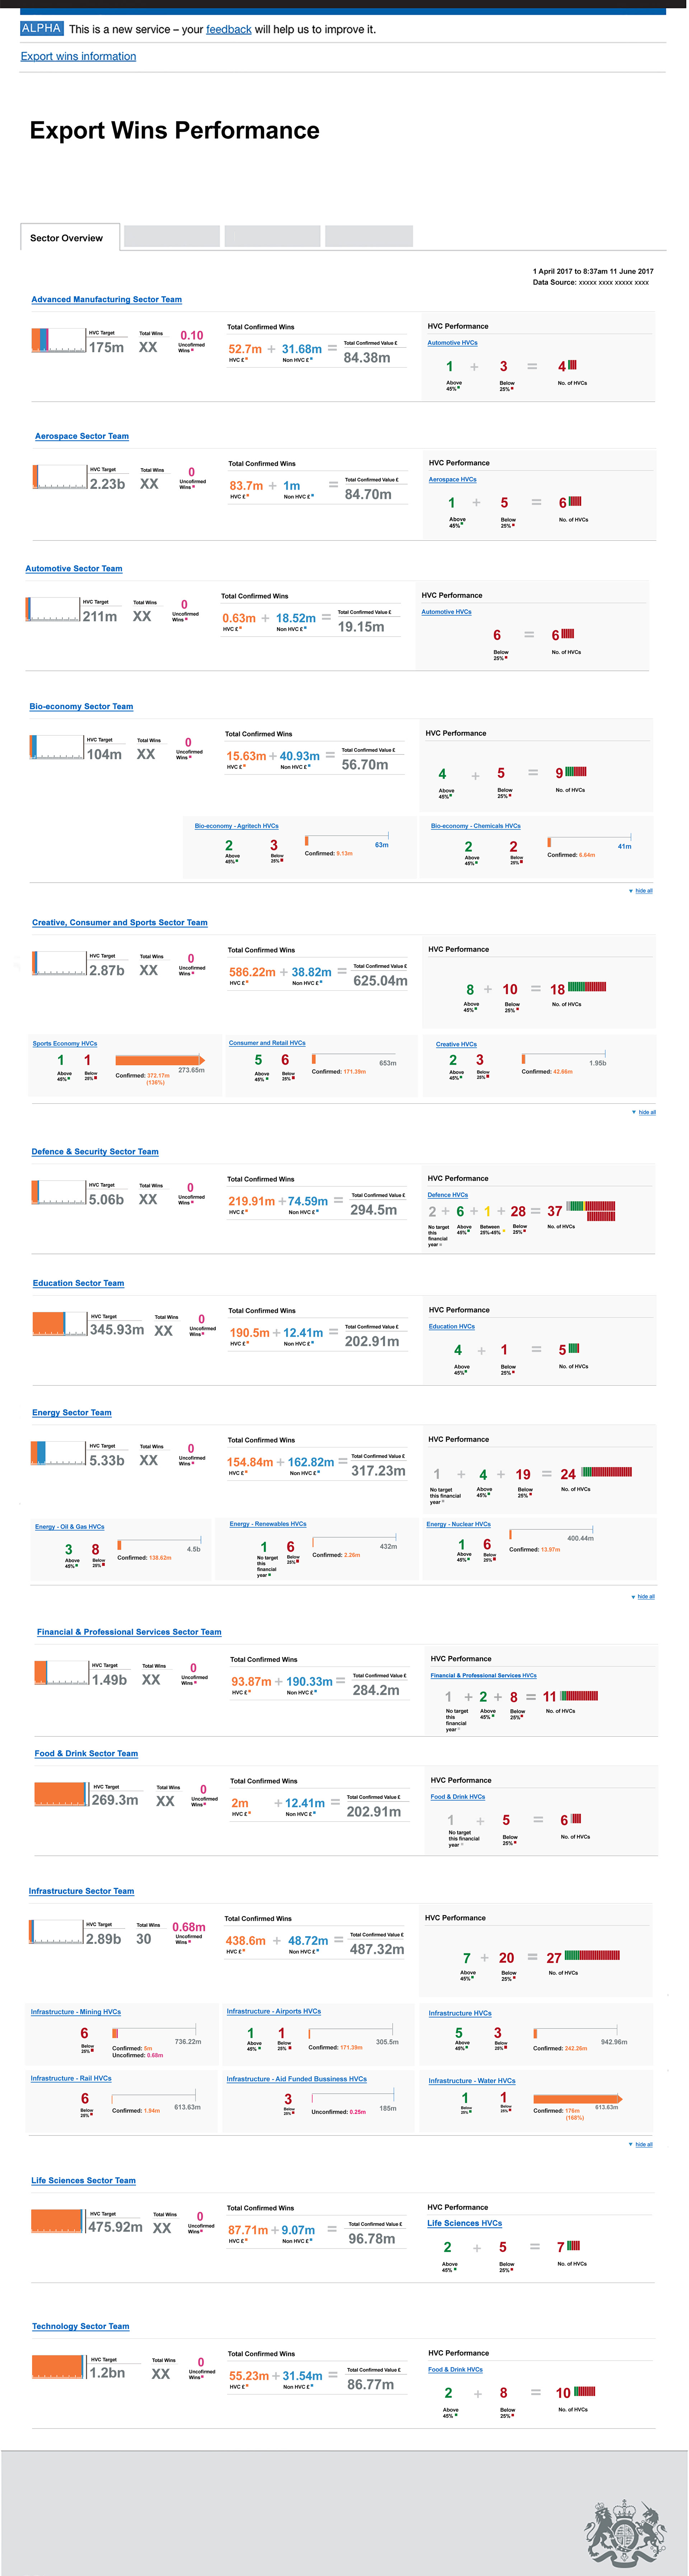
An initial design concept was sketched and introduced by a prior designer. Below is the initial concept design that the previous designer designed.
My process and methodology:
Discovery
Partnered with stakeholders to understand how they viewed the reports, how the reports are produced. Worked as part of a multidisciplinary team to translate user needs and service requirements into clear interaction models, ensuring that services are usable, consistent, and aligned with GDS standards.
Collaborated within cross-functional teams—including researchers, designers, business analysts, and stakeholders —to create user-focused needs and learned the key information the dashboard needed to display. Priostrised the primary, secondary and tertiary information that needed to be displayed.
Align design and business goals by working closely with leadership across the all portfolio teams and their leaderships including senior ministers, and the internal development team to decipher viability and timeframes.
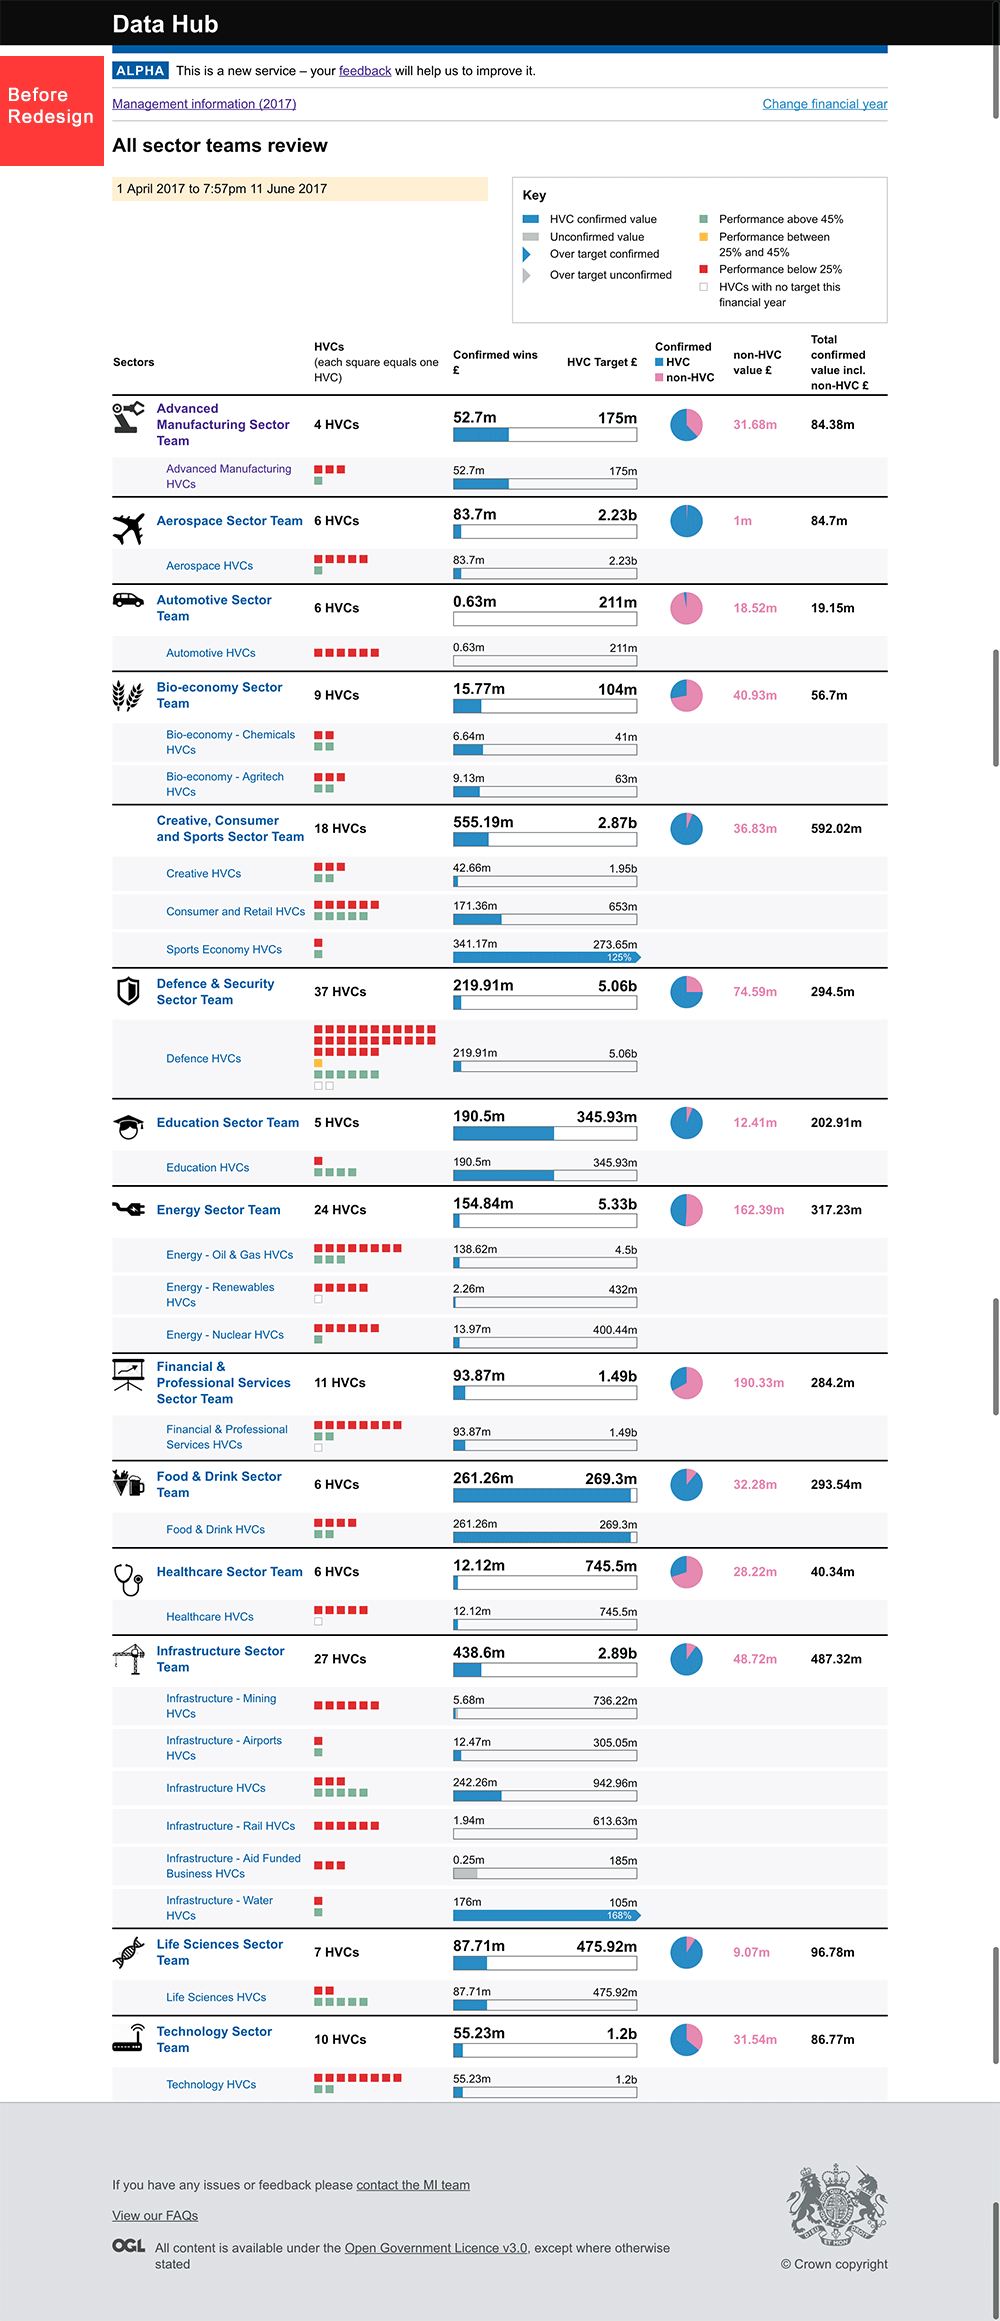
Conducted a heuristic review of the proposed design. The proposed design (above) had many issues, such as a lack of a search field; the key was too big and confusing, especially when the user would scroll the page. The key would disappear on scrolling the page, and the guide would be lost; the information display was very complicated and did not make sense easily. The design did not seem user-friendly, and there was no option to scroll through from bigger to smaller information. The HVC red icons depicted as small red squares needed to be counted manually, to decipher the numbers that are performing and the numbers that are not performing. The GDS standard was not applied.
Heuristic evaluation screen (below)

Heuristic review screens


Design process
Some of the findings of my research indicated the need for a simple, easy depiction of data and an at-a-glance convenience.
The wireframes designed from user needs and user journeys took care of the need of the users to see the ‘Global performance’ data at-a-glance and then trickle down to the views of data relating to Regions and Sectors.
In the new design, the user can choose the year they want to view through a drop-down menu present on the top of the home page of the dashboard. This was not present in the previous version. In the previous version, the user would have needed to leave the dashboard to go to another page and select the year they would like to view.
Clear labels about the data displayed were introduced as well. Simple, clean data figures, with strong visual hierarchy, were introduced, keeping in line with the GDS guidelines.

Graphs displaying data, labels and a simple visual representation of targets were introduced. The aim was to design simple depictions which anyone could understand (even people who are not working with this data regularly). More information from the 'key' was used as labels for the graphs, providing better definition and simple explanations to complex data.

Initially on the sector overview section, a display was designed with blocks instead of rows for easier scrolling and quick access for all portfolio stakeholders. Later, through user testing, I found that the portfolio stakeholders would like a simple row for their portfolio instead of blocks, as they felt that it simplified the view and helped with quick access. Since it was a popular demand, different views were tested and it resulted into changing the design into row view dashboard. However, later on, the user was given the choice of viewing their dashboard with either view.